Introduction
In the intricate landscape of IBM Engineering Lifecycle Management (ELM), the significance of a robust monitoring system cannot be overstated. At Softacus, we leverage powerful tools like Zabbix and Grafana to actively monitor logs, providing a seamless and efficient solution for keeping the IBM ELM system under constant control.
A Unified Approach
The essence of effective monitoring lies in the ability to comprehensively observe and interpret logs. With our monitoring system, we bridge the gap between IHS and ELM logs, offering a unified approach to log management. This not only simplifies the monitoring process but also enhances the overall efficiency of your system
The following image shows logs from IBM ELM. You can see logs count and which severity of logs there are and logs as records in which you can find specific records with a timestamp and description.
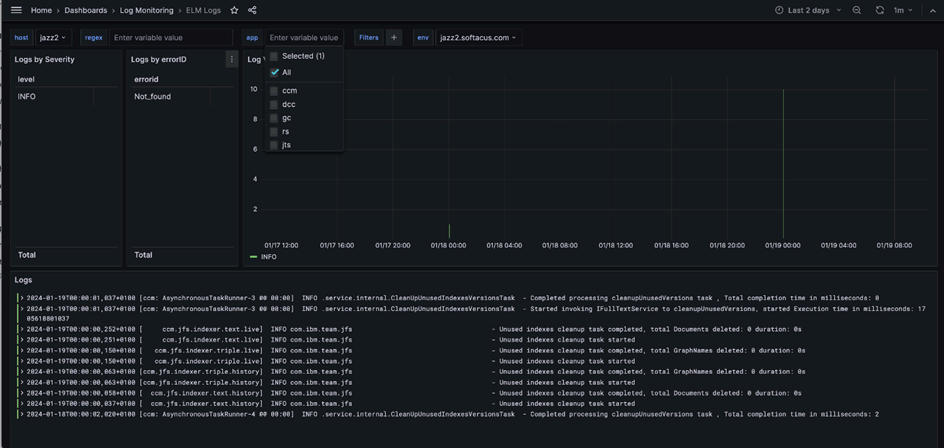
1.) IBM ELM Logs
The following image shows logs from IHS (reverse proxy), where you can find logs volume and how many logs were successful or redirected. Same as in previous you can see specific records with a timestamp and description.
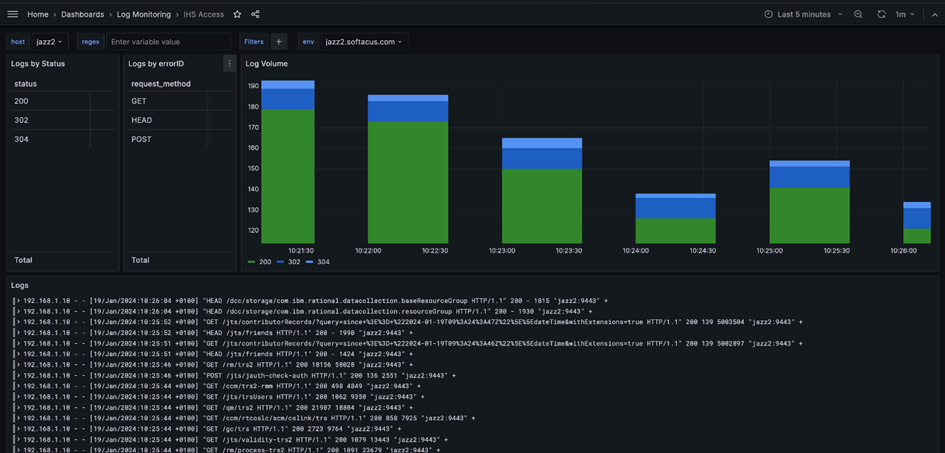
2.) IHS Logo
Breaking Down the IBM ELM Logs
One of the standout features of our monitoring system is its capability to provide real-time insights into the IBM ELM logs. No more manual log checks or server access – our system actively fetches, analyzes, and presents the logs in an accessible format. This real-time visibility is crucial for understanding the system's dynamics and responding promptly to any anomalies.
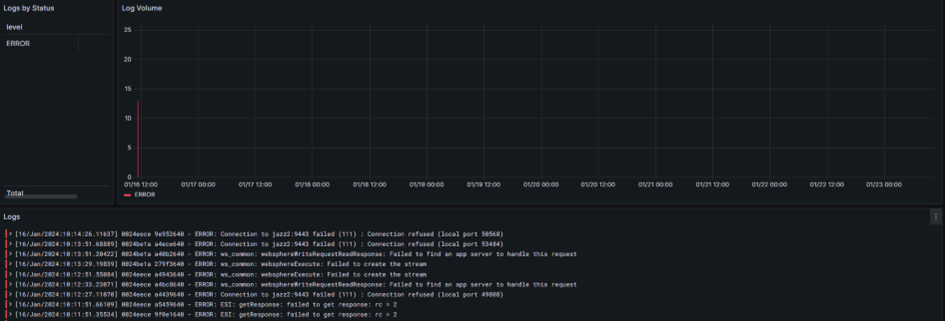
The following image shows ELM logs with severity levels, like INFO, DEBUG, etc. and logs errorID by which you can solve problems. There are a logs count with severity flags and logs summary.
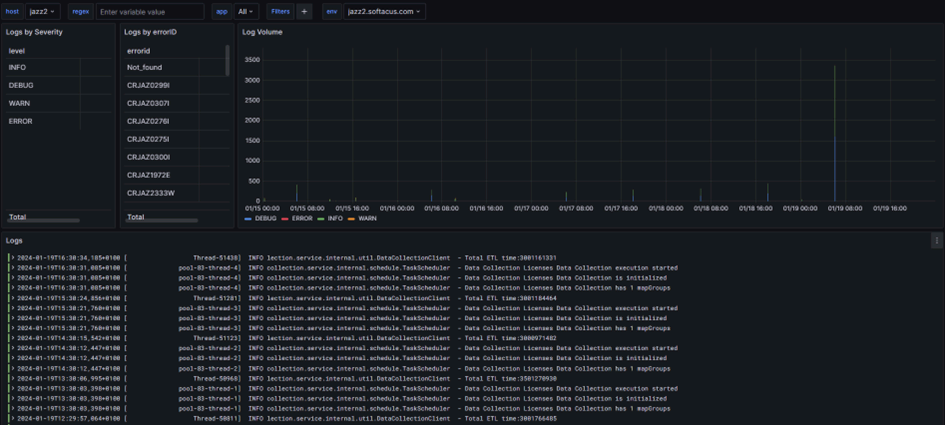
1.) ELM Logs
A Deeper Dive
In the realm of IHS (reverse proxy), our monitoring tools allow for a granular examination of logs. We track IHS errors, access details, and plugin-related information. This detailed monitoring ensures that every aspect of IHS performance is scrutinized, offering a comprehensive view that aids in identifying and addressing issues promptly.
The following image shows IHS access logs. By this dashboard you can monitor access to your system and how many requests were successful and how many were restricted or redirected.
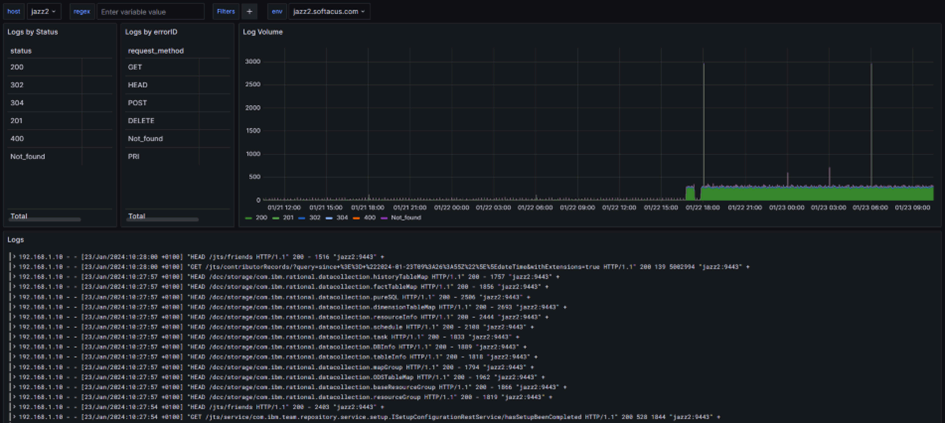
4.) IHS Access logs
The following image shows monitoring of IHS plugins, where you can see errors in communication.
5.) IHS Plugins
Managing the Influx of Information
In a complex system like IBM ELM, log volumes can quickly become overwhelming. Our monitoring system doesn't just collect logs, it intelligently tracks log volumes. This feature provides insights into the intensity of activities within the system, helping your team manage information influx efficiently.
Targeted Insights for Proactive Management
Not all logs are created equal. Our system categorizes logs based on ErrorID and severity, offering targeted insights into potential issues. This proactive approach allows administrators to prioritize and address critical issues swiftly, preventing potential downtimes or performance hiccups.
The following image shows logs by their severity level and by errorID. ErrorID can help to solve problems.
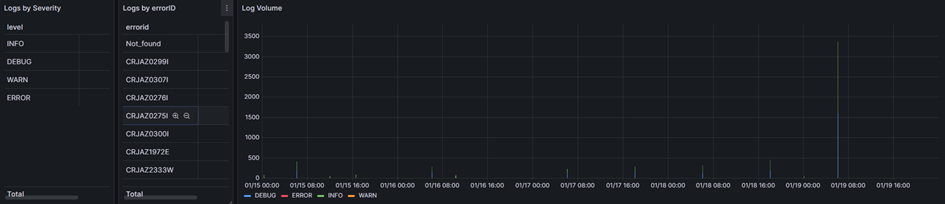
6.) Logs by severity and error ID
Enhancing User Experience with Grafana
Grafana, a key component of our monitoring system, introduces a visual dimension to log analysis. Through intuitive graphs and charts, Grafana transforms raw log data into a visual narrative. This not only enhances the user experience but also simplifies the interpretation of complex log information.
A Complex Ecosystem Requires Constant Vigilance
IBM ELM is a sophisticated ecosystem where every component plays a crucial role. From requirements management to engineering test management, the interconnected nature of ELM demands vigilant oversight. Our monitoring system ensures that nothing escapes attention, providing a safety net that actively contributes to the system's stability.
Empowering Your ELM Journey with Smart Monitoring
In the dynamic realm of IBM ELM, where each action reverberates across the system, monitoring becomes more than a necessity – it's a strategic advantage. Softacus' approach to logs monitoring, coupled with the prowess of Zabbix and Grafana, empowers your team with real-time insights and proactive management capabilities. It's not just about logs; it's about unlocking the full potential of your IBM ELM (Jazz) ecosystem.
Softacus Services
We, in Softacus, are experts when it comes to consulting and service delivery of IBM software products and solutions in your business. We help our clients to improve visibility and transparency when licensing and managing commercial software, providing measurable value while increasing efficiency and accountability and we are providing services in different areas (see Softacus Services).
IBM ELM extensions developed by Softacus are free of charge for the customers who ordered IBM ELM licenses via Softacus or for the customers who ordered any of our services. If you are interested in any of our IBM ELM extensions, you found a bug or you have any enhancement request, please let us know at info@softacus.com.
Related and Referenced Topics
Blog Articles:
Basics of Links and Link Types in IBM DOORS Next Generation - learn the basics about the linking and link types in IBM DOORS Next.
Linking Techniques in IBM DOORS Next - article explaining basic concepts and showing multiple ways of creation of links between artifacts.
Link By Attribute Feature in IBM DOORS Next - the article explains how to use the "Link by attribute" function to automatically create, update, or delete one or more links between artifacts based on values in the attributes of the artifact.
Softacus Widgets:
Link Switcher - widget developed by Softacus, that converts the context of artifacts links in a very short time.
Module Link Statistics - extension that provides users with a quick overview of the amount of the links in specific link types in a module.
Link Type Change- extension developed by Softacus designed to enhance the functionality of DOORS Next Generation by allowing users to manipulate the direction of a link or convert it to another type of link.
Links Builder- extension that allows the users to create a link between two artifacts in DOORS Next Generation according to the certain rules.
Link by Foreign Attribute - this extension allows users to create links between artifacts in the selected module(s), based on the attributes values.
Show Attributes of Linked Artifacts - this extension shows the attributes and links of the artifact that is currently selected.