Maximo Asset Monitor
Monitoring solution that enables real-time visibility, root-cause troubleshooting, and AI driven alerts at scale

Key Benefits of IBM Maximo Asset Monitor

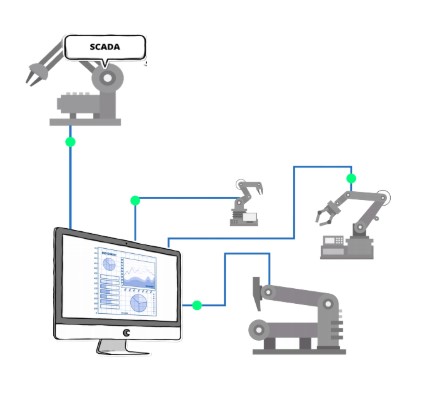
Connecting the Enterprise
Data integration from multiple sources of data about operating state.

Operate at Scale
Ability to scale and visualize operations across
enterprise through single dashboard.

AI-Powered Anomaly Detection
Advanced analytics and AI that can quickly detect
issues and leverage data from operating history.

Root Cause Analytics
Alert notifications and drilldown capabilities for
resolution teams.

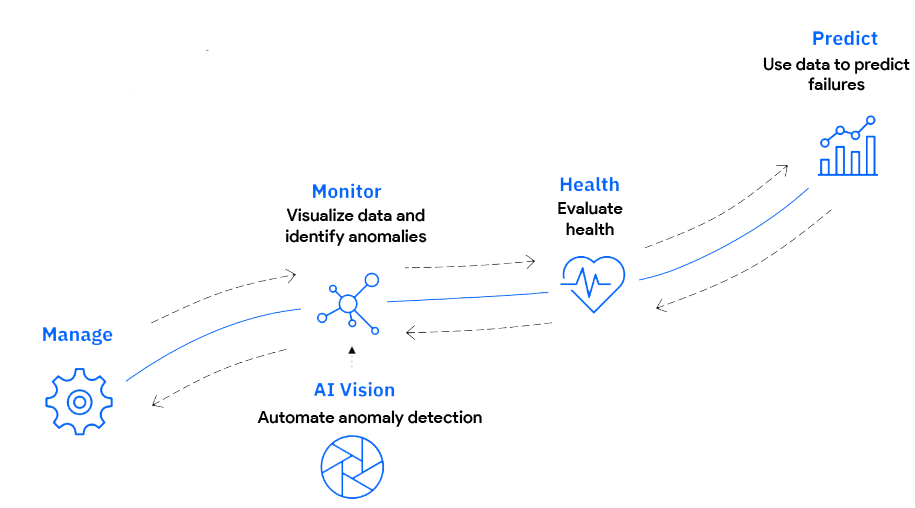
Journey to Predict
Monitor is the foundation for predictive maintenance
and asset health.
The solution

Connected enterprise
Connects OT data sources
Reduces operating costs through continuous
inspections
Improves asset and operational availability
Configurable dashboard for customized views
Scales easily across processes and sites
Improves operational control
Supports remote monitoring

Visibility at scale

AI-Powered Anomaly Detection
Leverages IBM’s market leading position in AI
Drives understanding beyond traditional
fixed-parameter alerts
Understand the patterns in the noise that are
easily missed
Enables drill-down for intelligent intervention
Access historical data for forensic analysis of
failure trends
Workflow integration to fast-path resolution

Root Cause Analytics

Journey to Predcit
Extract immediate value from your data
Gain access to IBM’s massive AI and
Analytics investments
Maximo Asset Monitor The Process

Connect

Prepare

Visualization

Investigate
Maximo Asset Monitor
The Process: Connect
Easily connect IT & OT enterprise data & devices at scale, while mapping to asset hierarchy
- Connect to IT and OT Data
Sources with Pre-built connectors

- Establish active connection
to EAM system

- Map entity data and devices
to Asset Hierarchy from
EAM system.
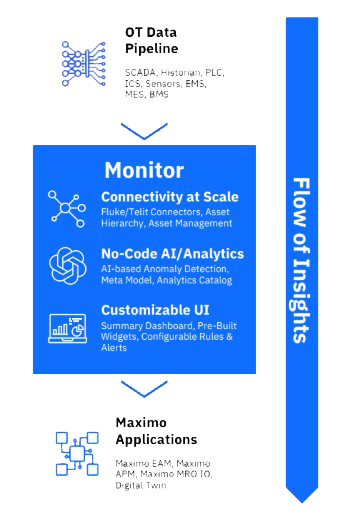
Maximo Asset Monitor
The Process: Prepare
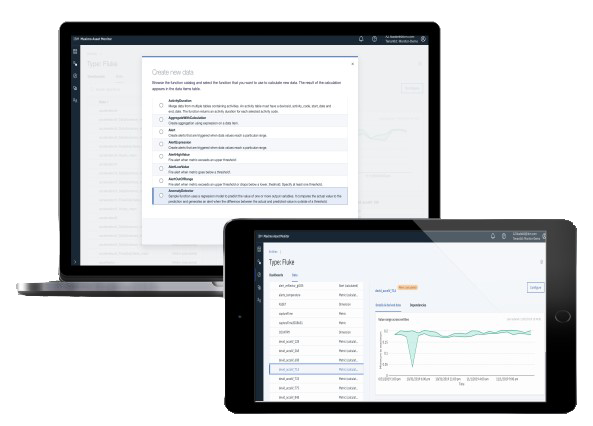
Easily enable advanced analytics and AI-based anomaly detection for alerts in a low-code/no-code environment

One click add AI-based analytics from the prebuilt catalog of functions to apply to data

Set alerts based on analytics and anomaly detection scores

View result of all calculations in the data tab before using in summary dashboard
Maximo Asset Monitor
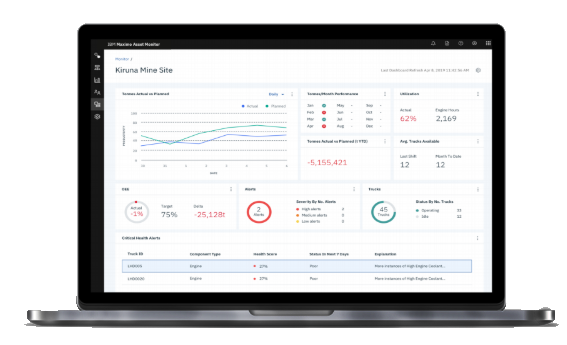
The Process: Visualize
Create customized dashboards with drag and drop pre-built widgets, showcasing embedded analytics, AI-
based alerts and visualizations of your operations

Build customized dashboards
based on use case with prebuilt
drag and drop widgets
Show outputs of AI-based anomaly detection and analytics, highlighting meaningful alerts within the widgets
Monitor your operations and KPIs, including key drivers for metrics like OEE, Availability, Uptime, and others
Maximo Asset Monitor
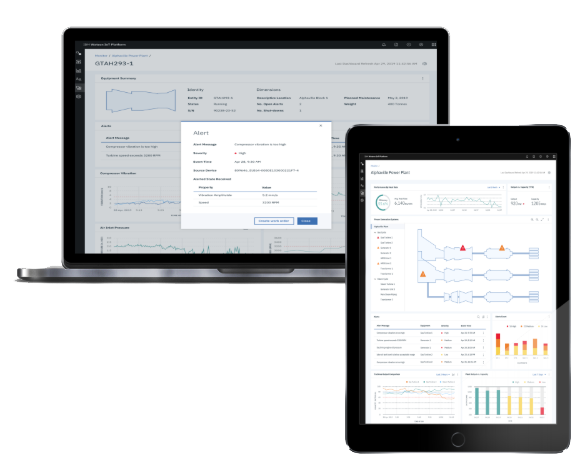
The Process: Investigate
View meaningful AI-based alerts, drill down from system to sensor, and create action to ensure uptime
Drill down from a plant to a system, component, asset, and sensor view

Investigate problems and root
causes that affect tracked KPIs

Create Automated Action ased on AI-based Alerts to ensure Uptime
Journey to Predictive
Improves uptime and reduces maintenance costs
Maximo Asset Monitor
Why Leverage?
- Enterprise level data aggregation & visibility
- Scale operations across processes & sites
- AI-powered detection of issues
- Enable drill down analysis for resolution teams
- Extensible IoT foundation